A blog on the repair, operation and calibration of surface analysis systems and components including electron spectrometers, sputter ion guns and vacuum related hardware. Click on the Index tab below to see a list of all posts. Visit our website at http://www.rbdinstruments.com
AugerScan and AugerMap are “legacy” software applications originally developed for Windows 95 and 98, however they have been and continue to be updated for bug fixes, additional features, and operating system compatibility. Both applications (and the systems they run) are still going strong and support Windows 7 – 11.
While many customers are still content running their RBD-upgraded PHI systems on Windows XP (or 95-98!), Microsoft no longer supports those operating systems, making upgrading the OS or replacing those PCs inevitable. There are a few areas where the transitions is not as smooth as we’d yet like, and those are driver support and the legacy help system.
Drivers
RBD provides drivers for older Windows XP systems as well as drivers that are fully compatible with Windows 7 – 11. However, none of these drivers are currently digitally signed. Depending on your operating system, providing the rights to run unsigned drivers may be necessary upon installing the drivers and/or running the software.
Some of the errors you may encounter are cryptic, such as the following sometimes seen when installing unsigned drivers on Windows 10: “The hash for the file is not present in the specified catalog file”.
Thanks for the clarity, Microsoft!
The good news is that you should only have to take care of the issue once, not every time you are running the software. The bad news is the methods are different for each operating system version, and even different for the same exact operating system depending on the date it was installed and the PC BIOS.
For most versions of Windows, disabling driver signature enforcement can be accomplished easily by one of these methods.
For Windows 10 PCs that were installed (not updated) with build 1607 (Anniversary Edition), the Secure Boot feature of the BIOS must be turned off.
Help
The original Help system (largely unchanged since Windows 3.1) was phased out in Windows Vista. The context-sensitive help – also known as “what’s this?” or “right-click” help cannot be replaced (this was the information you would typically see for each field in a dialog box, for example). However, for Windows Vista through 8.1, Microsoft does provide separate downloads for the legacy help system; it’s just no longer installed in the operating system.
You can find most of those files on this Microsoft support page (scroll down to “Resolution”) For security reasons, Microsoft no longer supports this help format at all in Windows 10, and there are no third-party solutions available.
However, we’ve translated most of RBD’s help to HTML for both AugerScan and AugerMap. In each case, simply unzip the file to a convenient folder and run “index.html” in your browser.
This post shows you how to calibrate the Balzers QMH RF generators that are used on the PHI SIMSII and 6300/6600 series SIMS systems.
1. Load in a Molybdenum sample. Note that the sample mount covers on PHI sample mounts are made out of Molybdenum so if you have one of those on your sample you can use the cover.
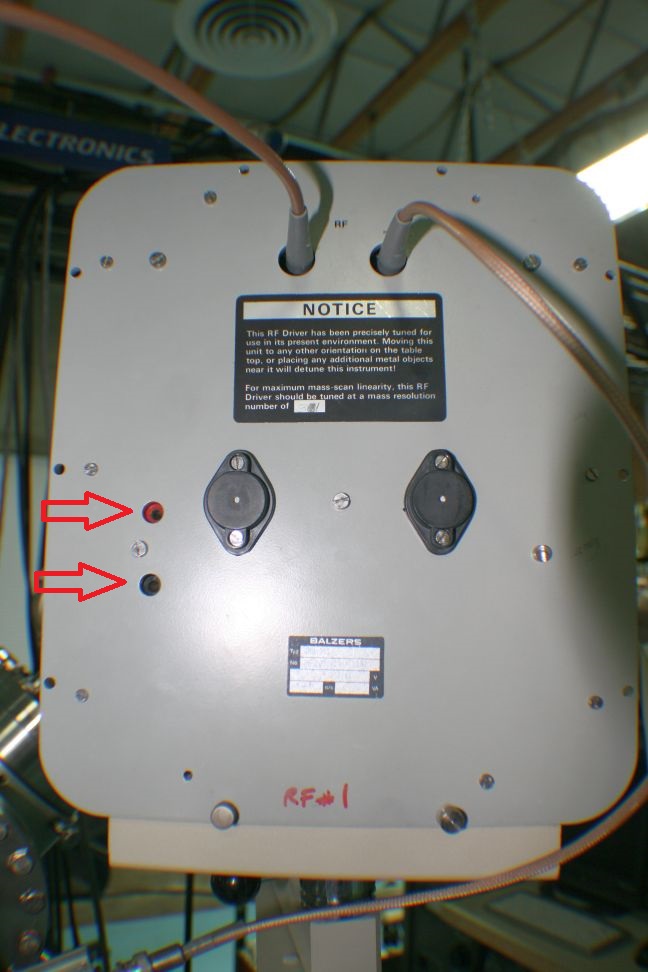
2. Monitor the voltage on the two recessed banana jacks on the front of the RF generator with a DVM set to DC millivolts.
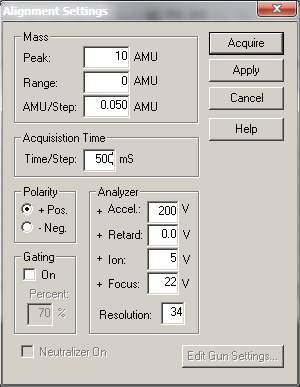
3. In AugerScan set up a SIMS alignment with a Peak AMU of 10 and a range of zero. Note that for this adjustment the ion beam does not need to be on.
4. Acquire the alignment and adjust the Tuning capacitor on the back side of the RF generator for the minimum voltage. The capacitor is a tuning type like what was used in old radios. The shaft of the capacitor is attached to a wheel with holes in it. To adjust the capacitor you put a small thin screwdriver or an Allen wrench into one of the holes and move the capacitor wheel left and right. There is a little bit of hysteresis in the adjustment so you will need to go back and forth a little bit to make sure that you are at the minimum voltage value.
The DC voltage will minimize at about 10 to 20mV depending on the RF generator AM range and the size of the quadrupole.
Once you have minimized the DC voltage stop the alignment. Change the AMU to 50 and repeat step 4.
5. Next change the AMU in the alignment to 200 AMU and adjust for minimum voltage. 200 AMU is as high as you will need to go as most of the RF generators only go up to a maximum of 250 AMU. But even if you have one that goes up to 500 or even 1000AMU, the effective signal above 200 AMU is minimal and so I think that it makes more sense to optimize the tuning over the effective range of the RF generator rather than the absolute maximum AMU. The voltage at 200 amu will be about 400 to 600mV depending RF generator AMU range and the quad diameter. The important thing is to minimize the voltage at 200 AMU.
After tuning the next step will be to adjust the peak positions.
6. The ion beam needs to be set up for normal operation and the raster turned OFF. Open the O2 leak valve on the SIMS II energy analyzer (top of SIMSII) and set it so that the vacuum in the chamber is 2 X 10⁻⁷ Torr. There is some hysteresis in the gas line so be very careful when adjusting this valve. My technique is to slowly open the valve and as soon as I see the pressure in the chamber starting to come up I close the valve ¼ turn and wait for the pressure to stabilize before further adjustment.
7. Set up an alignment in POS SIMS with an AMU of 16 and a range of 3. Set the time per step to 50ms.
8. Acquire the alignment and adjust the Cal LOW potentiometer on the RF generator so that the 16 AMU O2 peak is centered. Note that for this adjustment the ion beam needs to be on. CCW moves peak up.
9. Change the AMU to 98 and a range of 3. Adjust the Cal HIGH potentiometer on the RF generator so that the 98 AMU moly peak is centered. The 98 Moly peak will be the highest peak in the group of peaks between 92 and 100 AMU. CCW moves peak up.
10. Recheck the 16 AMU peak and readjust if necessary. If you adjust the 16 AMU peak then you will also need to adjust the 98 AMU peak as well.
Next we will adjust the resolution linearity. The resolution is adjusted by a combination of the Resolution number in the software and also the actual resolution fine potentiometer on the RF generator. We will adjust the resolution for what is called the 10% value. The 10% value represents the ratio between the 95 and 96 Moly peaks and when viewed in the log scale is one order of magnitude on the graph. We further will want to adjust the resolution linearity so that the peaks from 90 to 100 AMU and also 185 to 195 AMU on Moly are both showing approximately a 10% peak to valley ratio, as shown in the survey below.
The resolution number in the software acts like a resolution offset – it affects the entire range of AMU. The resolution gain potentiometer on the RF generator acts like a gain, it has more effect on the high AMU than the low AMU. By selecting the correct Resolution number in the software and adjusting the resolution Fine potentiometer on the RF generator the overall resolution linearity can be adjusted.
11. Set up two survey windows in AugerScan. One will be set from 90 to 100 AMU and the other from 185 to 195 AMU. Initially set the resolution in the software to the last known good value or the value that is written on the front of the RF generator. Use an AMU of .05 and a time per step of 50 ms, one sweep.
12. Acquire both surveys (one at a time).
In each window the goal is to have approximately 10% peak to valley ratio (in the log scale). Adjust the resolution number for the 90 to 100 AMU peaks and the resolution fine for the 185 to 195 peaks. CW = more resolution. Remember that the Resolution number in the software will affect both the low and high peaks, and that the resolution fine pot on the RF generator will have more effect on the high peaks than the low peaks. Here is a table that might be helpful-
Note that any time you change the resolution number for the 90 to 100 survey you need to change it to the same value for the 185 to 195 survey.
After a few iterations you will have the resolution set so that both the low and high AMUs are approximately 10% resolution.
13. Once the resolution linearity adjustment is complete, recheck the 16 AMU and 98 AMU peak positions and adjust if necessary.
If you run out of range on the resolution fine adjustment or the cal low peak position contact RBD Instruments for additional procedures on how to correct those issues.
The following post is a Secondary Ion Mass Spectroscopy Spectroscopy (SIMS) Tutorial ( PowerPoint in PDF format) complements of Eric Krosche. Although a destructive technique, SIMS is also the most sensitive surface analysis technique with detection limits as low as parts per billion.